argus view browser — local read-only web UI
After a scan produces argus-results.json, there are three ways to look at
it today: open the JSON directly (for engineers comfortable with the shape),
run argus view terminal (for engineers who live in the terminal), or
argus view browser — a tiny web app bundled with the SDK that serves the same
findings to anyone with a browser.
Aimed at owners, managers, and executives who want at-a-glance insight into their product's security posture without digging through CI logs or learning a TUI.
Install
pip install 'argus-security[browser]'
Pulls in FastAPI, uvicorn, Jinja2, and python-multipart (~10 MB total).
Without the extra, running argus view browser prints a friendly install hint and
exits cleanly — the extra is never required for argus scan or any other
subcommand.
Launch
argus view browser                          # picker rooted at CWD
argus view browser /path/to/results/        # load that scan directly
argus view browser /path/to/scans-parent/   # picker rooted there
argus view browser --port 9090              # non-default port
argus view browser --no-open                # skip auto-opening the browser (default opens it on TTY)
Localhost only. The server always binds to 127.0.0.1 — there is no
--bind flag by design. Single-user, single-machine is the product shape;
it's what makes "no auth, no sessions, no CSRF handling" the right scope.
For multi-user enterprise deployments, see the separate
argus-portal track.
Views
Persistent scan context. Every primary view (dashboard, findings, log) carries a slim sticky context bar under the header — project · source commit · when the scan ran · finding count — so you always know which scan you're looking at as you scroll and move between views. It's built on theme tokens, so it flips cleanly between light and dark, and degrades gracefully without JavaScript (the timestamp just stays in epoch form). On the picker and diff views, where there's no single scan in scope, it's omitted.
/ — Executive summary dashboard
Opens here by default.
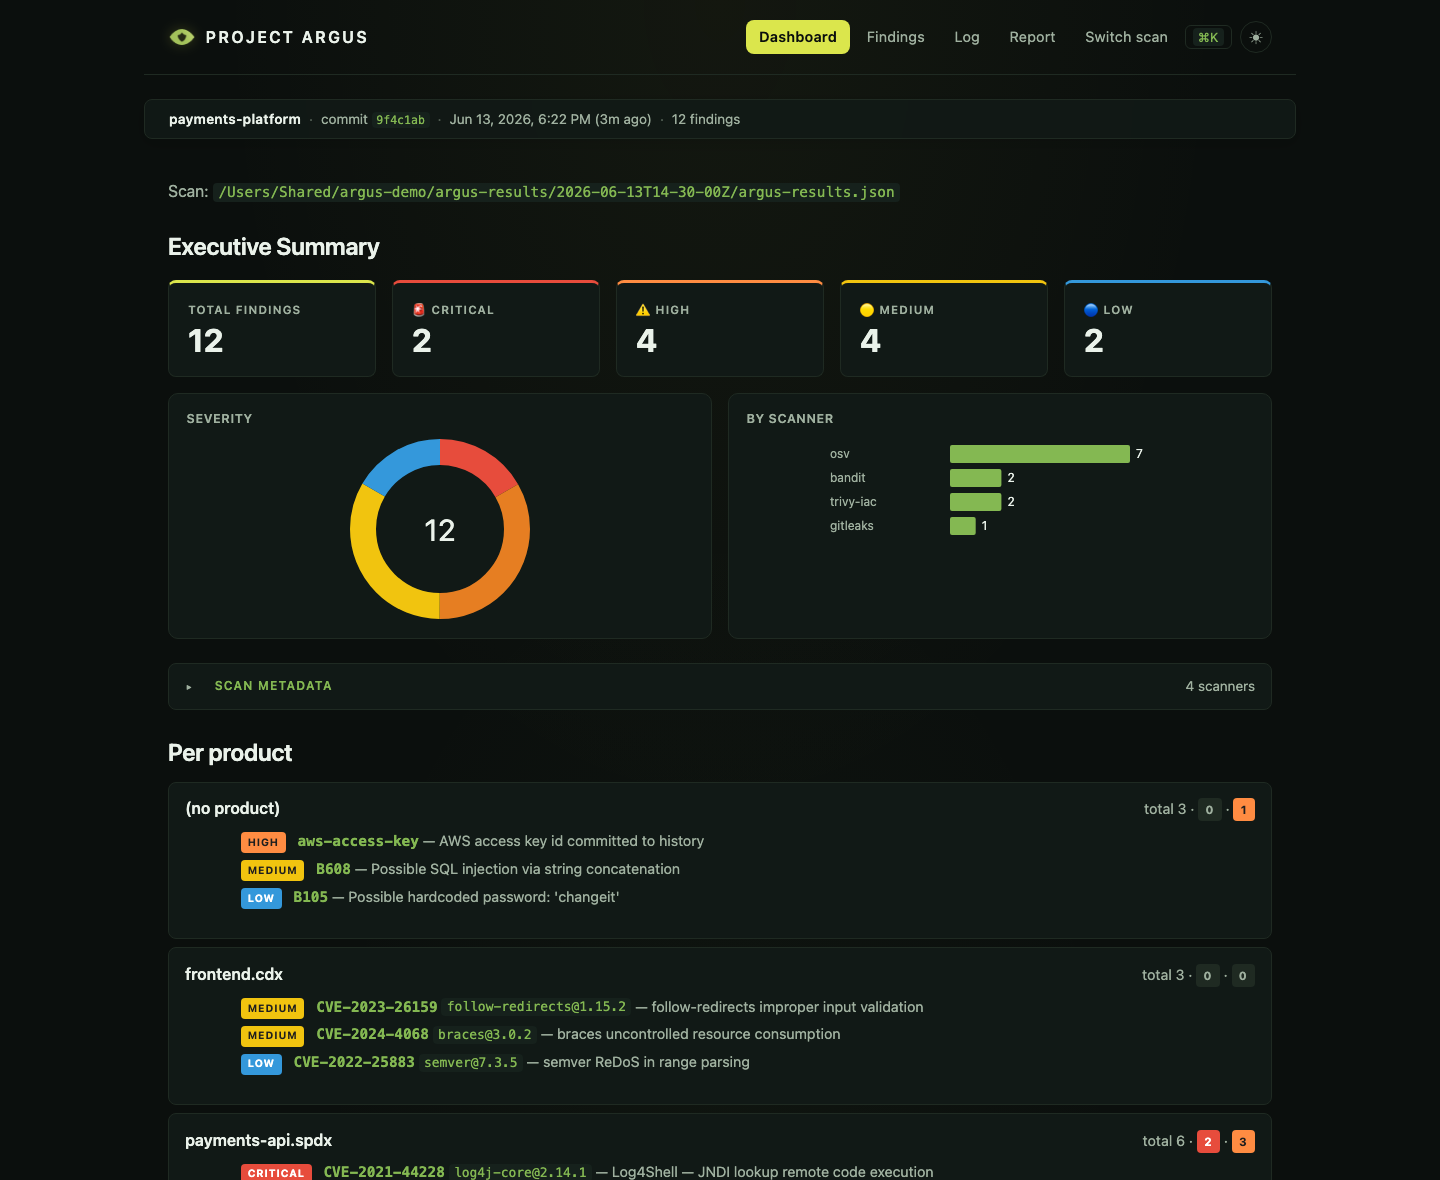
Shows:
- Total findings + per-severity breakdown (cards at the top, each a
deep-link into the matching
/findingsfilter) - Visual analytics — a severity donut, a findings-over-time trend
line (from the run history), and a by-scanner bar chart. Rendered as
inline SVG with no chart-library dependency; the line draws on and the
cards count up on load (motion is gated on
prefers-reduced-motion) - Scan quality warnings — SPDX-2.1 SBOMs Trivy can't read, low-purl coverage, Grype "couldn't identify scan subject" — surfaced loudly so empty scans aren't misread as clean
- Per product — every SBOM source with total + critical + high counts and the top-3 findings (severity, ID, package, title)
- Per scanner — contribution counts (useful for spotting when one scanner did 90% of the work, which often signals an input format issue)
Motion & polish. The viewer uses a dependency-free motion layer — the CSS View Transitions API cross-fades page navigations, cards/charts rise in on load, and the trend line draws on. All of it is wrapped in
prefers-reduced-motion, so the UI degrades to a fully static, accessible page (the screenshots above are captured in exactly that reduced-motion state).
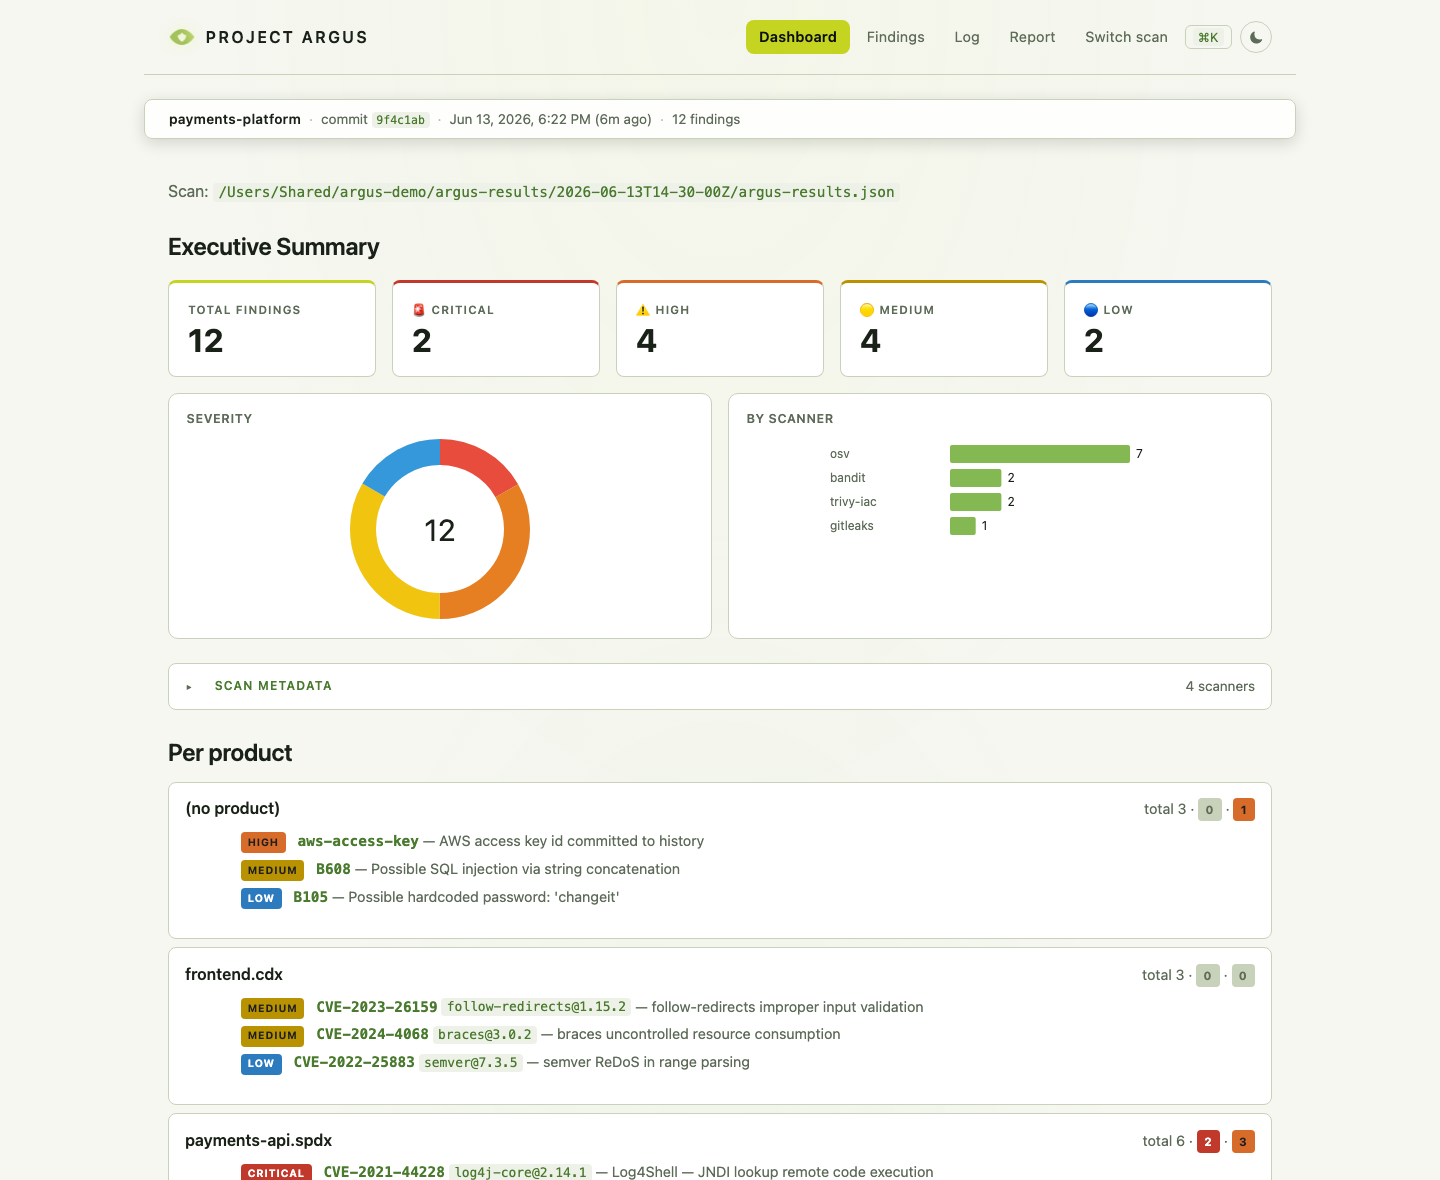
Light & dark themes. Everything — charts, cards, the command palette —
is built on theme tokens (the chart SVGs reference CSS custom properties, not
hardcoded colours), so it flips cleanly with the theme toggle / your OS
prefers-color-scheme:
Command palette (Cmd/Ctrl + K)
Browser parity with the TUI's Ctrl+P: a fuzzy launcher over the page's own
navigation — jump to any view, severity filter, product/scanner, or recent
run without the mouse. Press Cmd/Ctrl+K (or click the ⌘K chip in the
header), type to filter, ↑↓ + Enter to go.
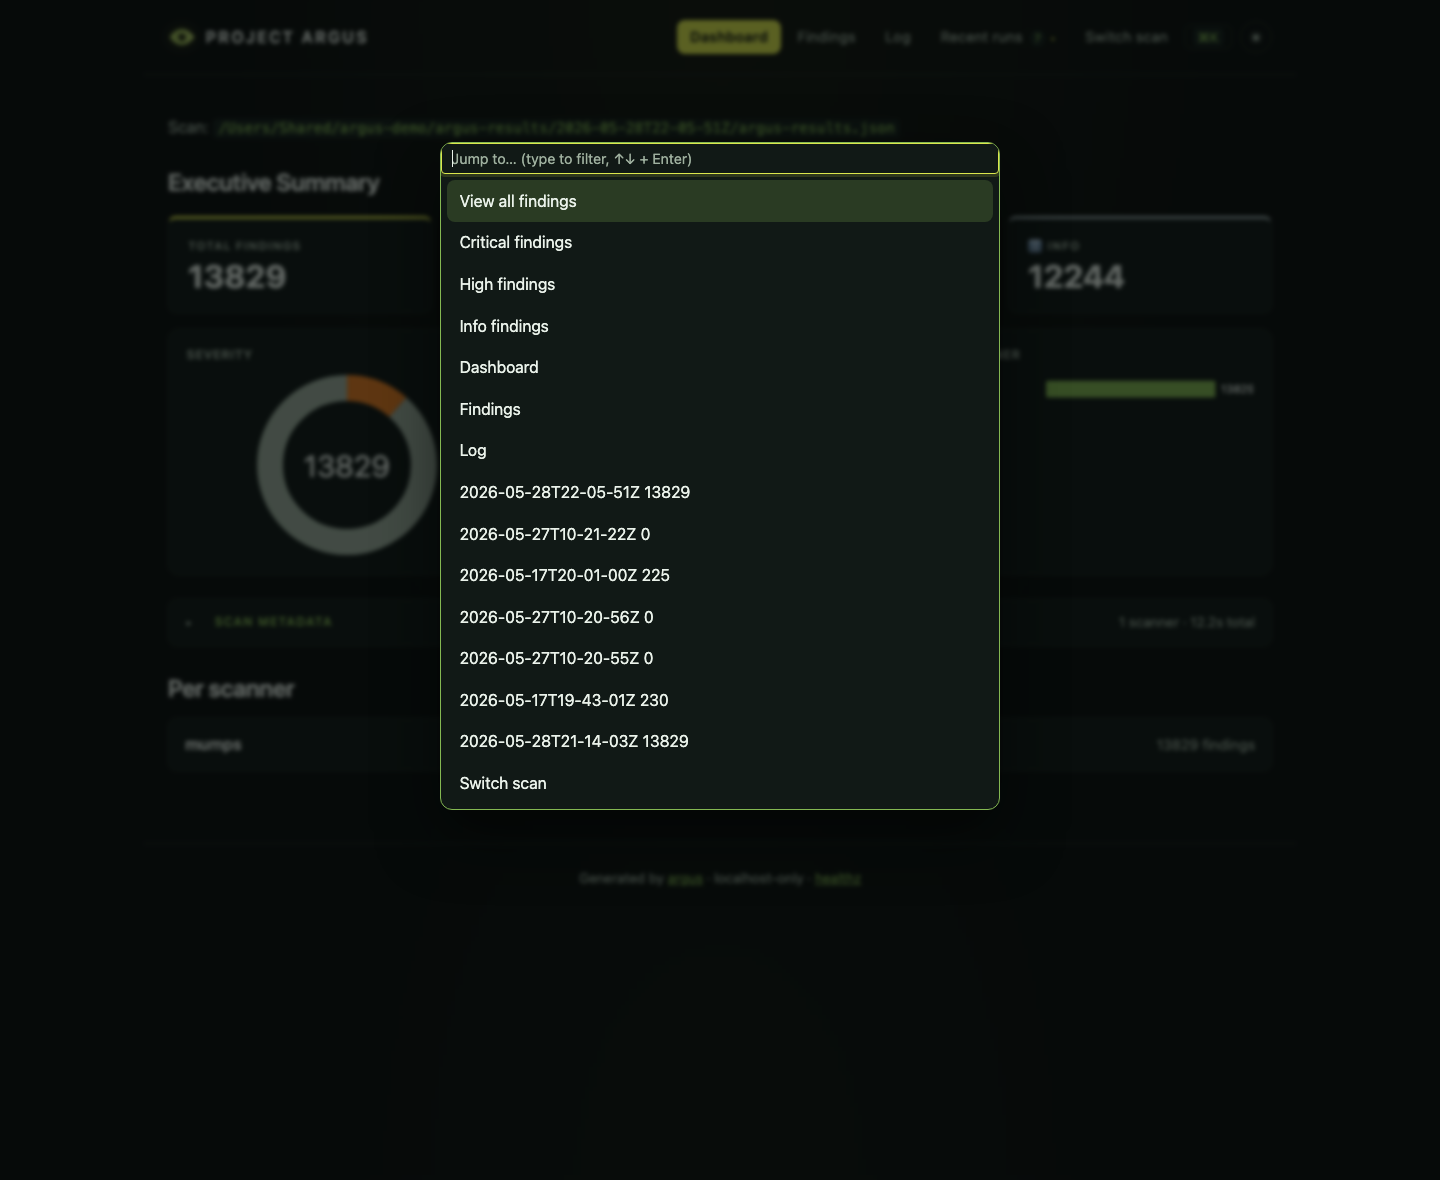
Vanilla JS, CSP-safe (it builds its overlay in the DOM and indexes existing links — no inline script, no data blob), and a no-op when JavaScript is off.
/findings — Filterable table
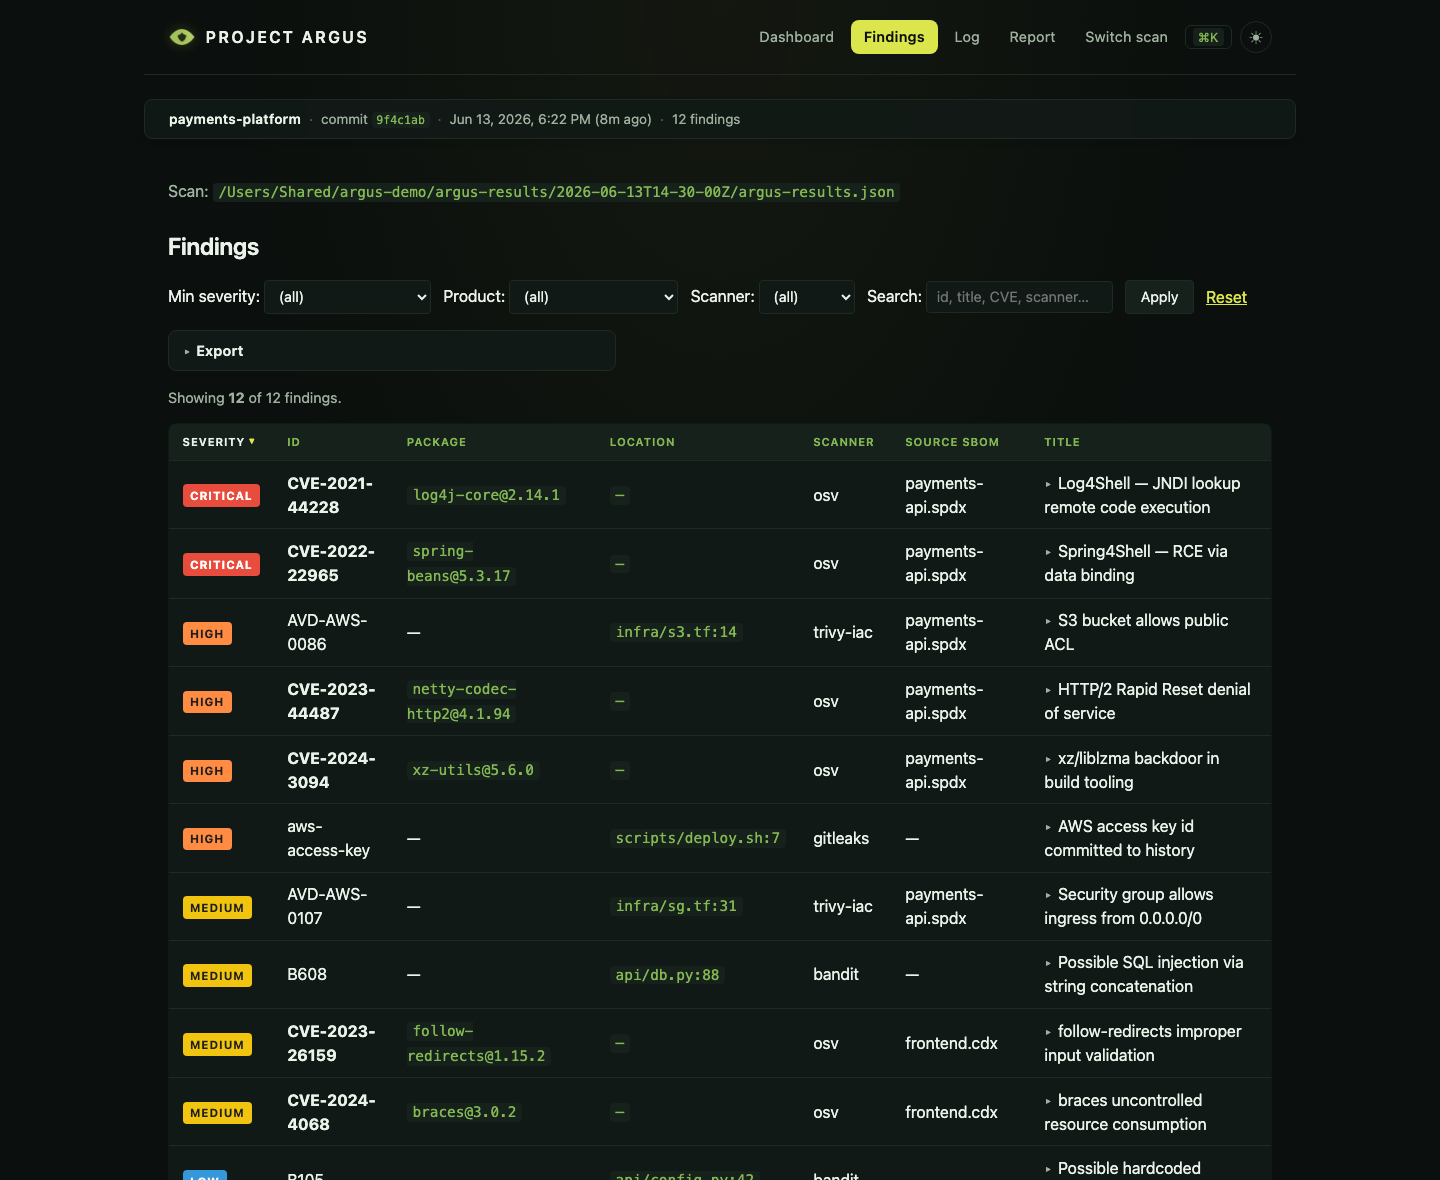
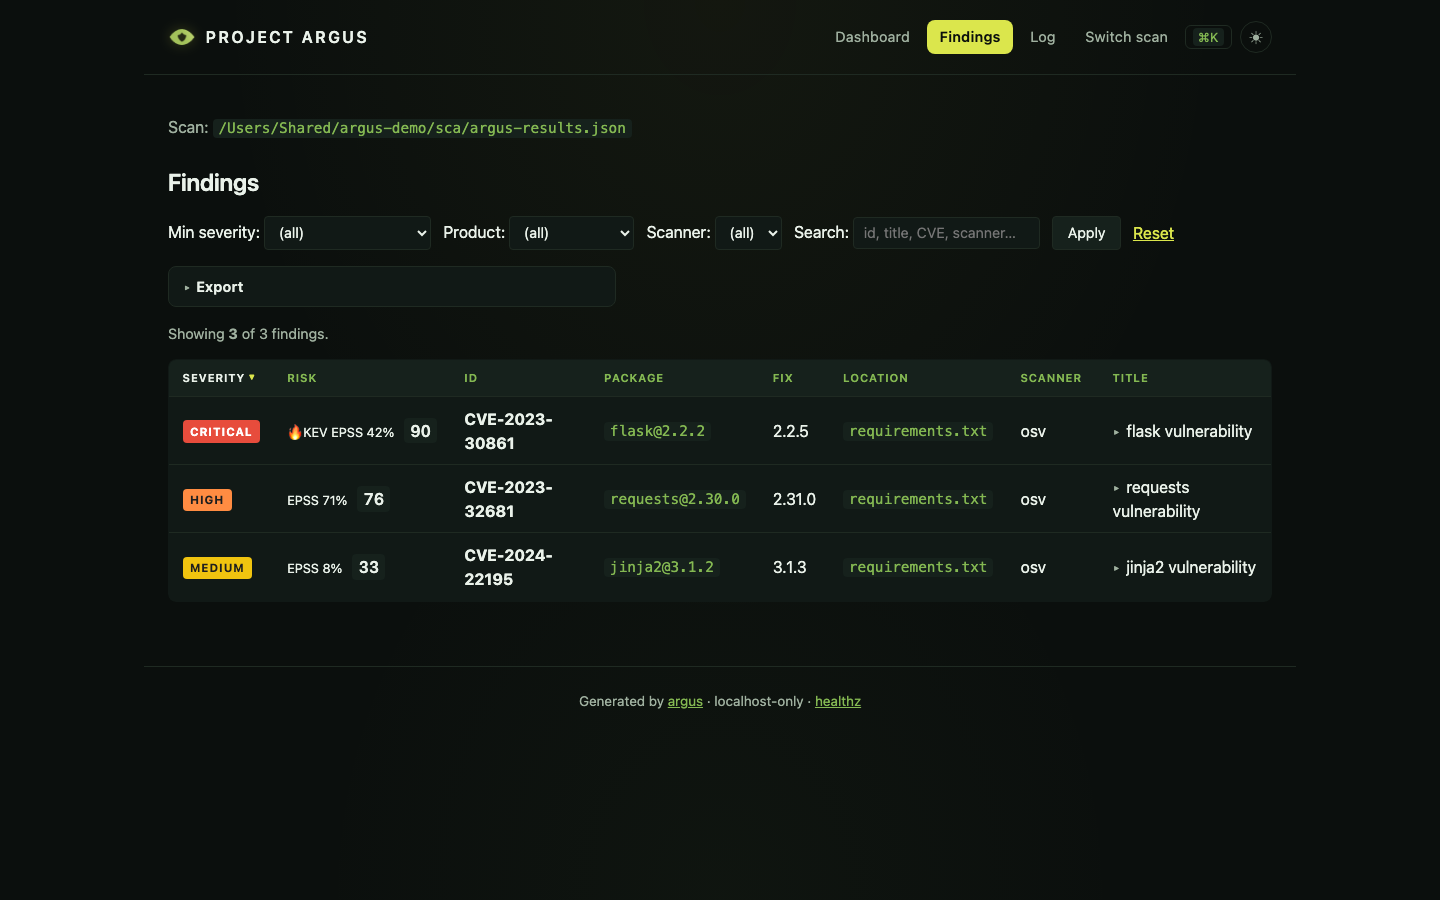
The spreadsheet view. Dropdown filters for severity, product, and scanner; a search box that matches id, title, location, CVE, and scanner name. Filters combine with AND semantics — the exact same logic the TUI uses.
URLs are bookmarkable:
http://localhost:8080/findings?scan=/path/to/results&min_severity=high&product=BVMS.spdx
JS-enhanced sessions get live filter updates without a page reload; non-JS clients see the same content via a plain form submit (Apply button is the fallback).
Risk column (EPSS + CISA KEV) — opt-in
Set ARGUS_VIEW_ENRICH=1 (or pass enrich=True to create_app) to add a
Risk column: for each CVE, the live EPSS exploit-probability and a
🔥KEV flag (CISA Known-Exploited), blended into a 0–100 risk score that
re-ranks by real-world urgency — an actively-exploited CVE rises above a
nominally-higher-severity one that isn't.
Off by default — the read-only / no-egress boundary holds. Enrichment only reaches the EPSS/KEV endpoints when you opt in; results cache on disk; only public CVE ids leave the host. Reachability ("is the package imported in source?") is deliberately not offered here — it scans source files, which belongs in the trusted-shell terminal viewer (
argus view
terminal
, theiaction), not the read-only browser.
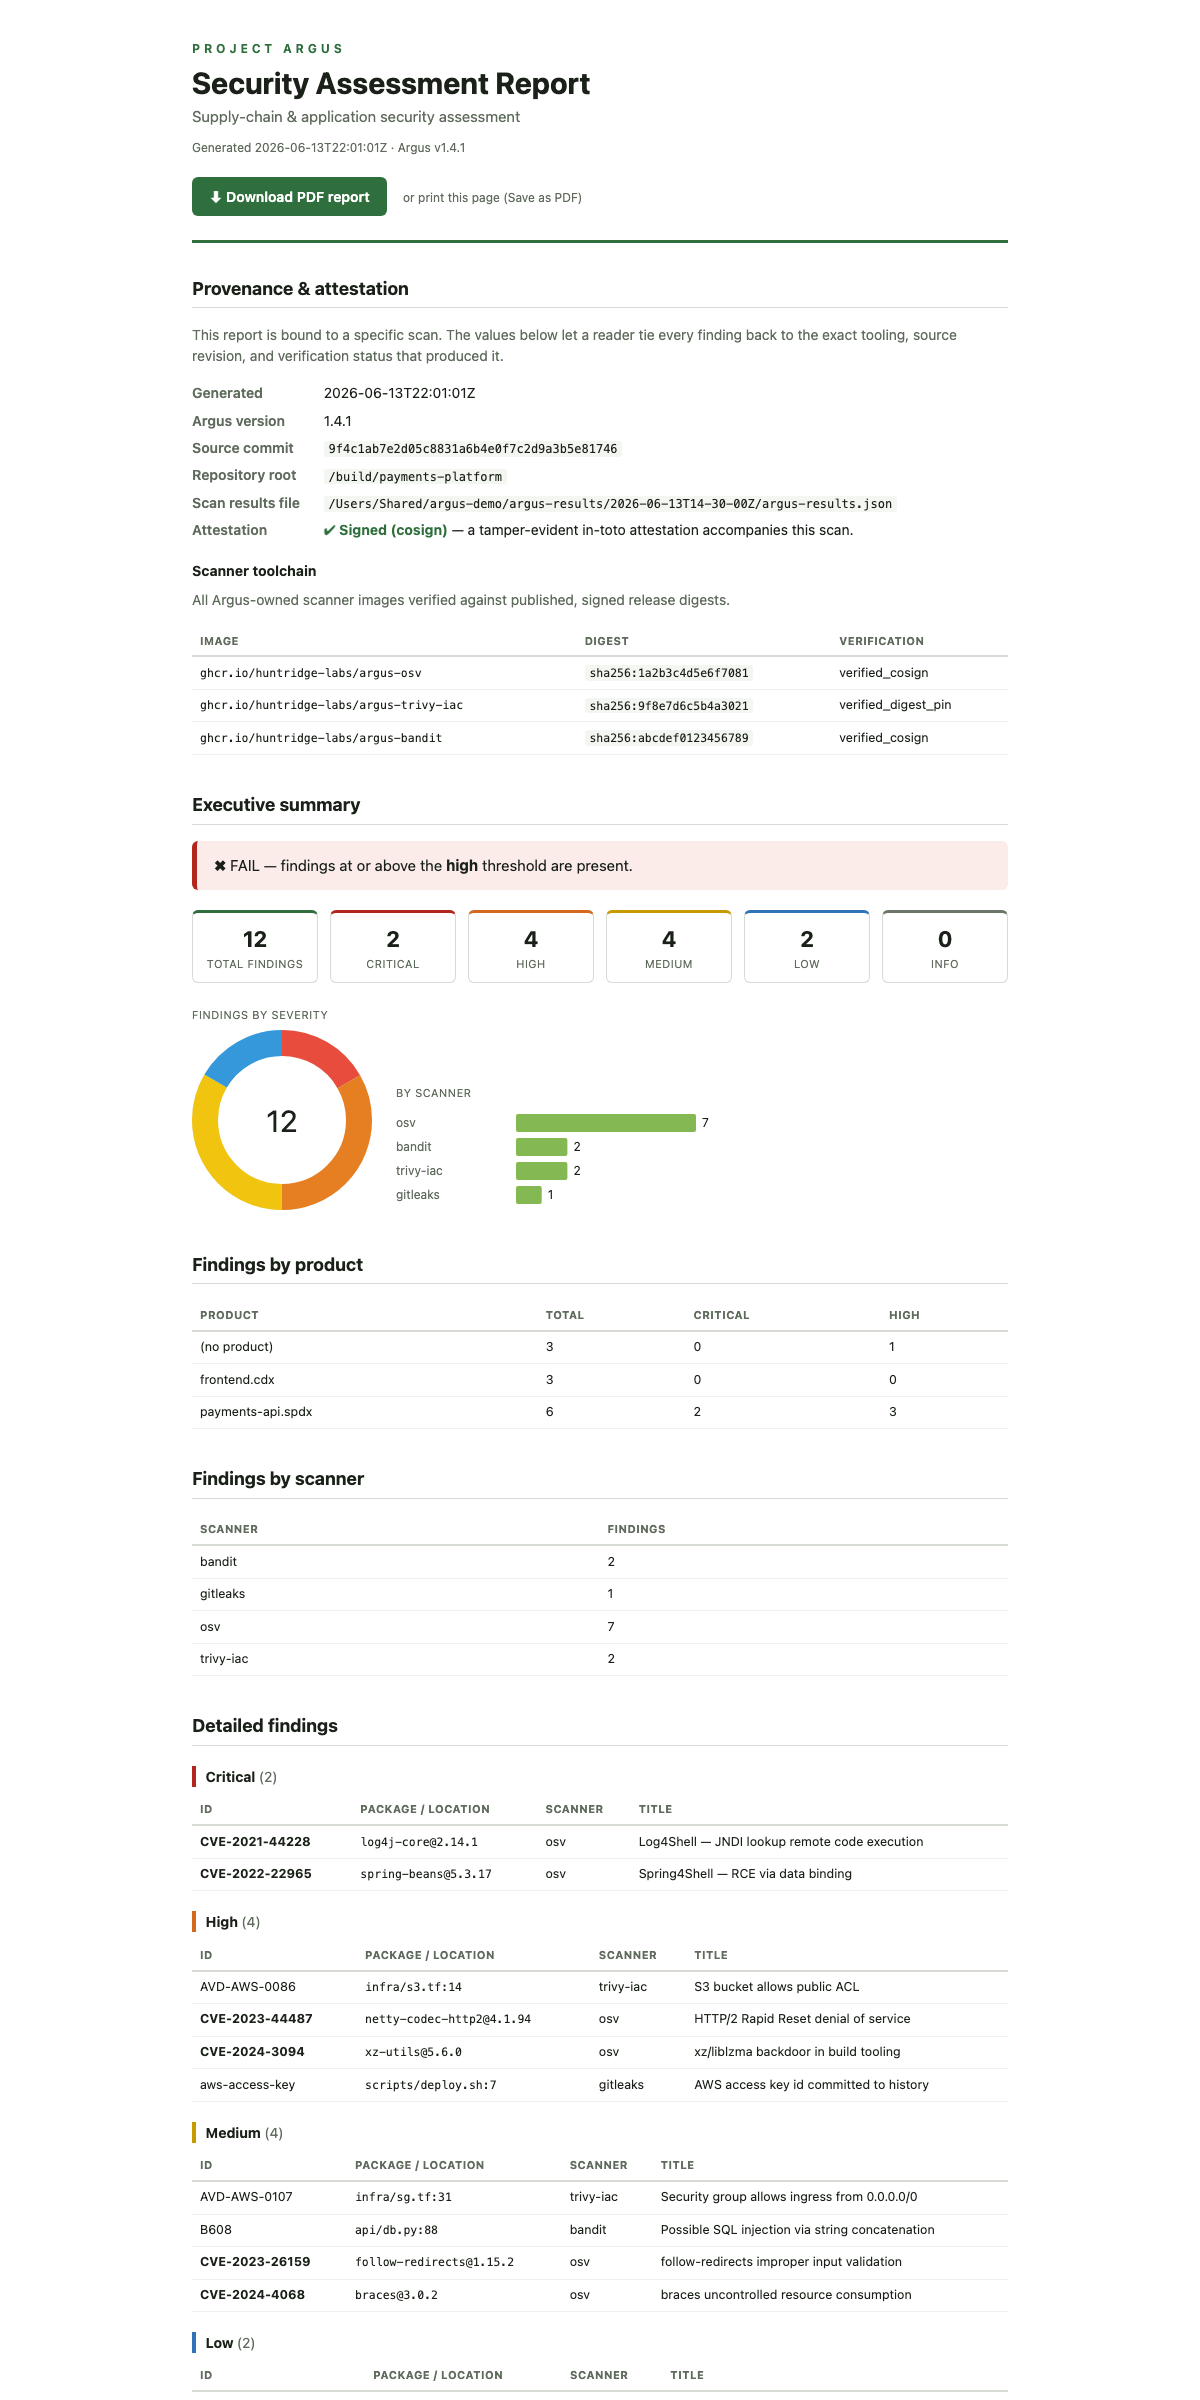
/report — Formal vulnerability report (Argus Enterprise add-on)
The authoritative artifact. Where the dashboard is collapsible, filterable, and
built for triage, the report is a single linear document built to be printed,
archived, and handed to an auditor — the kind of evidence a compliance officer
or a government body can act on. What makes it authoritative is the
provenance & attestation block: the exact Argus version, the source commit
SHA the scan actually saw, each scanner container image + sha256 digest + its
cosign/digest verification status, and whether a signed in-toto attestation
accompanies the scan — so every finding ties back to a specific, verifiable
scan rather than a screenshot. Below it: a PASS/FAIL verdict, severity counts +
charts, per-product / per-scanner breakdowns, and the full findings inventory
grouped by severity.
Report generation (the HTML report and the one-click, server-side PDF) is an
Argus Enterprise capability — the open-source viewer ships no report. That is
deliberate: a report served as HTML could be saved to PDF from the browser,
which would give away the paid artifact. The dashboard and findings views stay
free; the authoritative, archivable report is the paid deliverable. With the
add-on installed, the /report and /report.pdf routes light up on this same
viewer through the argus.viewers.browser_plugins seam. Learn more or request
access: https://www.huntridgelabs.com/.
/picker — Switch scan
A one-level file browser. Click into subdirectories; any directory containing
an argus-results.json gets a "Load scan" button with a finding-count peek.
Dotfiles and common build directories (node_modules, .git, .venv, etc.)
are hidden by default; ?show_hidden=1 reveals them.
Deliberately non-recursive — users drive the navigation. That keeps the picker fast (no filesystem walk on every request) and avoids decisions about depth limits and gitignore semantics.
/healthz
Liveness check. Returns {"status": "ok", "root": "<picker-root>"}. Handy
for scripts that need to know when the server has started up.
Security posture
- CSP header on every response:
default-src 'self'; style-src 'self'
  'unsafe-inline'; script-src 'self'
. Blocks inline scripts and any cross-origin resources. X-Frame-Options: DENY— the dashboard can't be framed into a parent page (harmless in the localhost-only context, defensive against future non-localhost deployments).- Jinja2 autoescape — scanner-supplied text (finding titles, descriptions) is HTML-escaped before reaching the page. Combined with the CSP, an attacker-controlled CVE description can't execute script in the browser.
- No auth, no cookies, no sessions — localhost-only means single user; there's nothing for a session to represent.
- No mutations — every route is
GET. Nothing on the server to defend against CSRF. - Input sanitization — filter values passed via URL are validated; bogus
min_severity=??falls back to "no filter" instead of crashing the route.
Not in v1 (tracked as future roadmap items)
- Live reload when
argus-results.jsonchanges on disk. Right now: browser refresh to re-read the file. - Scan-over-scan diff — compare today's scan to last week's.
- JSON API endpoints — external tools (Slack bots, custom dashboards)
can read
argus-results.jsondirectly today; we'll add/api/...if a real use case shows up. - Recursive picker walks — one directory level at a time is the current design. If users ask for "find all scans under this tree," that's a separate UX decision (performance, gitignore semantics, skip-rules).
Architecture relationship to argus view terminal and argus-portal
Three UIs look at the same data; each has its own scope:
| Tool | Scope | Audience |
|---|---|---|
argus view terminal (TUI) |
Single scan, read-only | Engineer triaging in a terminal |
argus view browser (this) |
Single scan, read-only, local web | Owner / manager / exec on the same machine |
argus-portal |
Multi-scan, multi-user, persistent DB, OAuth, FedRAMP | Enterprise compliance organization |
argus view terminal and argus view browser share a module — argus.core.findings_view
— that owns the filter / sort / summary logic. ViewState semantics,
compute_summary output, and severity ordering are identical across the TUI
and the web view. A filter that produces 17 results in the TUI produces the
same 17 in the browser.
argus-portal is a separate project on a separate track. It doesn't share
code today; when it matures, we may factor a third consumer onto
findings_view so all three agree on what "high severity" means and which
findings match which filter.
Troubleshooting
argus: error: argument command: invalid choice: 'serve' — argus serve
was renamed. The browser UI is now argus view browser (or
argus view --interface=browser). Update your command.
"The browser interface needs the 'browser' extra" — you installed
argus-security but not the [browser] extra. Retry with
pip install 'argus-security[browser]'.
Port 8080 already in use — pass --port 9090 (or any free port).
Browser didn't auto-open — we use the stdlib webbrowser
module which is generally reliable but can fail silently in headless or
SSH-remoted environments. The URL is printed to stdout — open it manually.
Page renders "No scan loaded" — the directory you pointed argus view browser
at doesn't contain an argus-results.json. Use /picker to navigate to one,
or pass ?scan=/abs/path on /.
Related
argus scan— produces theargus-results.jsonthis UI reads.argus scan --interface=terminal— launches the TUI after a scan.argus view terminal— keyboard-driven TUI for the same data.- SDK roadmap — the migration record and any surviving follow-ups.